The BMS Lab develops and maintains our own in-house developed software. Both researchers and students can use the software in their work after signing up for their project.
TIIM aims to provide researchers with the capability to study participants long-term or repeatedly and present them with stimuli or measurement items based on a schedule or pre-determined conditions. TIIM allows researchers to create sets of questionnaires and present them to participants based on a schedule or conditions. TIIM studies can be adapted to individual participants thanks to item routing and questionnaire conditions. TIIM is ISO/NEN 7510/7512/7513 and GDPR compliant and it operates on ISO/IEC27001 certified infrastructure.
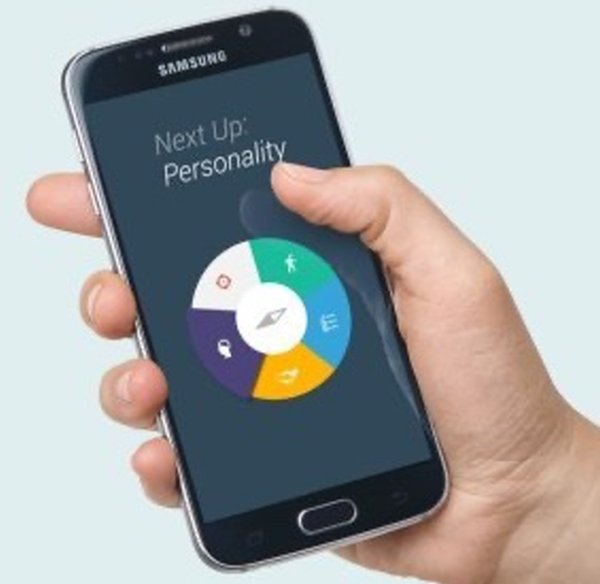
Career Compass (CC) is a web application that collects information from STEM students and professionals. Its purpose is to determine a participant’s (future) professional identity based on questions that are structured in five categories: participant’s goals, values, personality, competencies, and interests. When the participant answers the questions, they will receive personalised feedback about their personality and profile. You can read more about the purpose and use of Career Compass on the website of the research team.
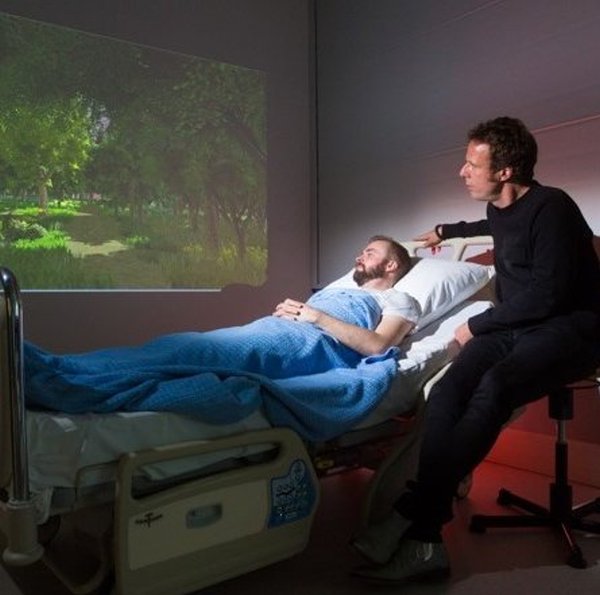
Researchers at UT have tried to distil the origins and measurable impact of nature and apply it where it matters most. The Virtual Nature concept is the result of their research and supports organisations and individuals to create a beneficial or 'healing' environment in their buildings, homes and offices. You can easily tailor the virtual nature environments and it allows for designing virtual nature environments with systematic manipulations of multiple nature characteristics.
ScriBe is a media playground app where you can visualise and analyse your data. You use your media file (mp3 or mp4) to get an insight into the data by choosing, for example, transcription or diarisation. Because of the modularity of the application, it is an ecosystem rather than just an application. You can work with us to add a service, such as a specific machine learning model, to modulate the visualisation and analysis data to your needs.
Status and Updates
The BMS Lab actively maintains the software. Here you can find information on the status of the software.
- The BMS Dashboard
Overall system status
No known problems that affect use:
- System status
- Website
- User Registration
- User login
- Email system
Notes and Issues:
8 March 2022 – Users report trouble logging in with their UT account. We are currently investigating the issue.
Changelog
No updates yet.
- Twente Intervention And Interaction Machine (TIIM)
Overall system status
No known issues that affect use:
- Front end (TIIM app)
- Notifications and reminders
- Participant registration
- New modules presented to participants
- Timing rules and temporary modules
- Metrics preview and data download
Notes and Issues:
- The Audio recording item in TIIM is malfunctioning and not allowing audio to be recorded. A fix is underway.
Changelog
- July 2022: First of 2 major summer updates was successfully deployed. Systems operational.
- September 2023: Large update was successfully deployed.
- Career Compass (CC)
Overall system status
- Front End (website)
- Sending feedback to participants
- New modules presented to participants
- Timing rules and temporary modules
- Metrics and data download
Notes and Issues:
Changelog
No updates yet.
Other software that is available
- Amberscript
The BMS Lab has a faculty license for the AmberScript speech 2 text audio transcription software suite. Amberscript can provide timestamped transcription for up to 6 speakers from both audio and video files. Transcriptions can be made in 29 languages. As a student, staff member or researcher affiliated with the BMS faculty, you can make use of Amberscript. The transcription software can be used in cases when transcripts of conversations and interviews are needed.
To gain access to Amberscript you have to register (https://www.utwente.nl/en/bmslab/registration/) your project.
- Qualtrics
To get access to qualtrics, no project regsitration is needed! However, you must be working on a project related to the BMS faculty and have ethical approval. Please follow the instructions on BMS datalab page on how to gain access to it.